Note
Go to the end to download the full example code
Example: Sine-skewed sine (bivariate von Mises) mixture
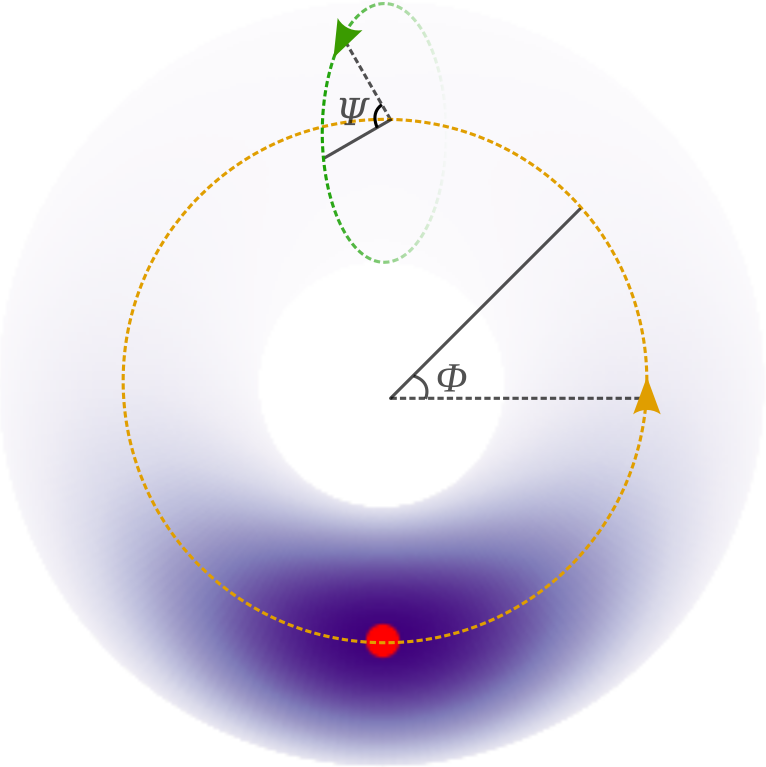
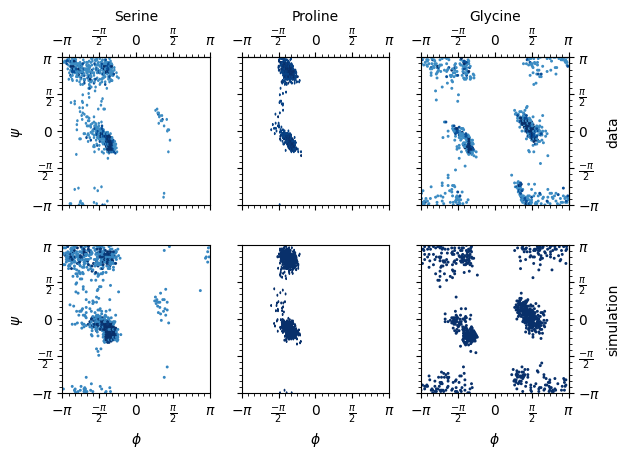
This example models the dihedral angles that occur in the backbone of a protein as a mixture of skewed directional distributions. The backbone angle pairs, called \(\phi\) and \(\psi\), are a canonical representation for the fold of a protein. In this model, we fix the third dihedral angle (omega) as it usually only takes angles 0 and pi radian, with the latter being the most common. We model the angle pairs as a distribution on the torus using the sine distribution [1] and break point-wise (toroidal) symmetry using sine-skewing [2].

References:
Singh et al. (2002). Probabilistic model for two dependent circular variables. Biometrika.
Jose Ameijeiras-Alonso and Christophe Ley (2021). Sine-skewed toroidal distributions and their application in protein bioinformatics. Biostatistics.

import argparse
import math
from math import pi

import matplotlib.colors
import matplotlib.pyplot as plt
import numpy as np
from sklearn.cluster import KMeans

from jax import numpy as jnp, random

import numpyro
from numpyro.distributions import (
    Beta,
    Categorical,
    Dirichlet,
    Gamma,
    Normal,
    SineBivariateVonMises,
    SineSkewed,
    Uniform,
    VonMises,
)
from numpyro.distributions.transforms import L1BallTransform
from numpyro.examples.datasets import NINE_MERS, load_dataset
from numpyro.infer import MCMC, NUTS, Predictive, init_to_value
from numpyro.infer.reparam import CircularReparam

AMINO_ACIDS = [
    "M",
    "N",
    "I",
    "F",
    "E",
    "L",
    "R",
    "D",
    "G",
    "K",
    "Y",
    "T",
    "H",
    "S",
    "P",
    "A",
    "V",
    "Q",
    "W",
    "C",
]


# The support of the von Mises is [-π,π) with a periodic boundary at ±π. However, the support of
# the implemented von Mises distribution is just the interval [-π,π) without the periodic boundary. If the
# loc is close to one of the boundaries (-π or π), the sampler must traverse the entire interval to cross the
# boundary. This produces a bias, especially if the concentration is high. The interval around
# zero will have a low probability, making the jump to the other boundary unlikely for the sampler.
# Using the `CircularReparam` introduces the periodic boundary by transforming the real line to [-π,π).
# The sampler can sample from the real line, thus crossing the periodic boundary without having to traverse the
# the entire interval, which eliminates the bias.
@numpyro.handlers.reparam(
    config={"phi_loc": CircularReparam(), "psi_loc": CircularReparam()}
)
def ss_model(data, num_data, num_mix_comp=2):
    # Mixture prior
    mix_weights = numpyro.sample("mix_weights", Dirichlet(jnp.ones((num_mix_comp,))))

    # Hprior BvM
    # Bayesian Inference and Decision Theory by Kathryn Blackmond Laskey
    beta_mean_phi = numpyro.sample("beta_mean_phi", Uniform(0.0, 1.0))
    beta_count_phi = numpyro.sample(
        "beta_count_phi", Gamma(1.0, 1.0 / num_mix_comp)
    )  # shape, rate
    halpha_phi = beta_mean_phi * beta_count_phi
    beta_mean_psi = numpyro.sample("beta_mean_psi", Uniform(0, 1.0))
    beta_count_psi = numpyro.sample(
        "beta_count_psi", Gamma(1.0, 1.0 / num_mix_comp)
    )  # shape, rate
    halpha_psi = beta_mean_psi * beta_count_psi

    with numpyro.plate("mixture", num_mix_comp):
        # BvM priors

        # Place gap in forbidden region of the Ramachandran plot (protein backbone dihedral angle pairs)
        phi_loc = numpyro.sample("phi_loc", VonMises(pi, 2.0))
        psi_loc = numpyro.sample("psi_loc", VonMises(0.0, 0.1))

        phi_conc = numpyro.sample(
            "phi_conc", Beta(halpha_phi, beta_count_phi - halpha_phi)
        )
        psi_conc = numpyro.sample(
            "psi_conc", Beta(halpha_psi, beta_count_psi - halpha_psi)
        )
        corr_scale = numpyro.sample("corr_scale", Beta(2.0, 10.0))

        # Skewness prior
        ball_transform = L1BallTransform()
        skewness = numpyro.sample("skewness", Normal(0, 0.5).expand((2,)).to_event(1))
        skewness = ball_transform(skewness)

    with numpyro.plate("obs_plate", num_data, dim=-1):
        assign = numpyro.sample(
            "mix_comp", Categorical(mix_weights), infer={"enumerate": "parallel"}
        )
        sine = SineBivariateVonMises(
            phi_loc=phi_loc[assign],
            psi_loc=psi_loc[assign],
            # These concentrations are an order of magnitude lower than expected (550-1000)!
            phi_concentration=70 * phi_conc[assign],
            psi_concentration=70 * psi_conc[assign],
            weighted_correlation=corr_scale[assign],
        )
        return numpyro.sample("phi_psi", SineSkewed(sine, skewness[assign]), obs=data)


def run_hmc(rng_key, model, data, num_mix_comp, args, bvm_init_locs):
    kernel = NUTS(
        model, init_strategy=init_to_value(values=bvm_init_locs), max_tree_depth=7
    )
    mcmc = MCMC(kernel, num_samples=args.num_samples, num_warmup=args.num_warmup)
    mcmc.run(rng_key, data, len(data), num_mix_comp)
    mcmc.print_summary()
    post_samples = mcmc.get_samples()
    return post_samples


def fetch_aa_dihedrals(aa):
    _, fetch = load_dataset(NINE_MERS, split=aa)
    return jnp.stack(fetch())


def num_mix_comps(amino_acid):
    num_mix = {"G": 10, "P": 7}
    return num_mix.get(amino_acid, 9)


def ramachandran_plot(data, pred_data, aas, file_name="ssbvm_mixture.pdf"):
    amino_acids = {"S": "Serine", "P": "Proline", "G": "Glycine"}
    fig, axss = plt.subplots(2, len(aas))
    cdata = data
    for i in range(len(axss)):
        if i == 1:
            cdata = pred_data
        for ax, aa in zip(axss[i], aas):
            aa_data = cdata[aa]
            nbins = 50
            ax.hexbin(
                aa_data[..., 0].reshape(-1),
                aa_data[..., 1].reshape(-1),
                norm=matplotlib.colors.LogNorm(),
                bins=nbins,
                gridsize=100,
                cmap="Blues",
            )

            # label the contours
            ax.set_aspect("equal", "box")
            ax.set_xlim([-math.pi, math.pi])
            ax.set_ylim([-math.pi, math.pi])
            ax.xaxis.set_major_locator(plt.MultipleLocator(np.pi / 2))
            ax.xaxis.set_minor_locator(plt.MultipleLocator(np.pi / 12))
            ax.xaxis.set_major_formatter(plt.FuncFormatter(multiple_formatter()))
            ax.yaxis.set_major_locator(plt.MultipleLocator(np.pi / 2))
            ax.yaxis.set_minor_locator(plt.MultipleLocator(np.pi / 12))
            ax.yaxis.set_major_formatter(plt.FuncFormatter(multiple_formatter()))
            if i == 0:
                axtop = ax.secondary_xaxis("top")
                axtop.set_xlabel(amino_acids[aa])
                axtop.xaxis.set_major_locator(plt.MultipleLocator(np.pi / 2))
                axtop.xaxis.set_minor_locator(plt.MultipleLocator(np.pi / 12))
                axtop.xaxis.set_major_formatter(plt.FuncFormatter(multiple_formatter()))

            if i == 1:
                ax.set_xlabel(r"$\phi$")

    for i in range(len(axss)):
        axss[i, 0].set_ylabel(r"$\psi$")
        axss[i, 0].yaxis.set_major_locator(plt.MultipleLocator(np.pi / 2))
        axss[i, 0].yaxis.set_minor_locator(plt.MultipleLocator(np.pi / 12))
        axss[i, 0].yaxis.set_major_formatter(plt.FuncFormatter(multiple_formatter()))
        axright = axss[i, -1].secondary_yaxis("right")
        axright.set_ylabel("data" if i == 0 else "simulation")
        axright.yaxis.set_major_locator(plt.MultipleLocator(np.pi / 2))
        axright.yaxis.set_minor_locator(plt.MultipleLocator(np.pi / 12))
        axright.yaxis.set_major_formatter(plt.FuncFormatter(multiple_formatter()))

    for ax in axss[:, 1:].reshape(-1):
        ax.tick_params(labelleft=False)
        ax.tick_params(labelleft=False)

    for ax in axss[0, :].reshape(-1):
        ax.tick_params(labelbottom=False)
        ax.tick_params(labelbottom=False)

    if file_name:
        fig.tight_layout()
        plt.savefig(file_name, bbox_inches="tight")


def multiple_formatter(denominator=2, number=np.pi, latex=r"\pi"):
    def gcd(a, b):
        while b:
            a, b = b, a % b
        return a

    def _multiple_formatter(x, pos):
        den = denominator
        num = int(np.rint(den * x / number))
        com = gcd(num, den)
        (num, den) = (int(num / com), int(den / com))
        if den == 1:
            if num == 0:
                return r"$0$"
            if num == 1:
                return r"$%s$" % latex
            elif num == -1:
                return r"$-%s$" % latex
            else:
                return r"$%s%s$" % (num, latex)
        else:
            if num == 1:
                return r"$\frac{%s}{%s}$" % (latex, den)
            elif num == -1:
                return r"$\frac{-%s}{%s}$" % (latex, den)
            else:
                return r"$\frac{%s%s}{%s}$" % (num, latex, den)

    return _multiple_formatter


def main(args):
    data = {}
    pred_datas = {}
    rng_key = random.PRNGKey(args.rng_seed)
    for aa in args.amino_acids:
        rng_key, inf_key, pred_key = random.split(rng_key, 3)
        data[aa] = fetch_aa_dihedrals(aa)
        num_mix_comp = num_mix_comps(aa)

        # Use kmeans to initialize the chain location.
        kmeans = KMeans(num_mix_comp)
        kmeans.fit(data[aa])
        means = {
            "phi_loc": kmeans.cluster_centers_[:, 0],
            "psi_loc": kmeans.cluster_centers_[:, 1],
        }

        posterior_samples = {
            "ss": run_hmc(inf_key, ss_model, data[aa], num_mix_comp, args, means)
        }
        predictive = Predictive(ss_model, posterior_samples["ss"], parallel=True)

        pred_datas[aa] = predictive(pred_key, None, 1, num_mix_comp)["phi_psi"].reshape(
            -1, 2
        )

    ramachandran_plot(data, pred_datas, args.amino_acids)


if __name__ == "__main__":
    parser = argparse.ArgumentParser(
        description="Sine-skewed sine (bivariate von mises) mixture model example"
    )
    parser.add_argument("-n", "--num-samples", nargs="?", default=1000, type=int)
    parser.add_argument("--num-warmup", nargs="?", default=500, type=int)
    parser.add_argument("--amino-acids", nargs="+", default=["S", "P", "G"])
    parser.add_argument("--rng_seed", type=int, default=123)
    parser.add_argument("--device", default="gpu", type=str, help='use "cpu" or "gpu".')

    args = parser.parse_args()
    assert all(
        aa in AMINO_ACIDS for aa in args.amino_acids
    ), f"{list(filter(lambda aa: aa not in AMINO_ACIDS, args.amino_acids))} are not amino acids."
    main(args)